Welcome |
Video Manual |
Downloads |
Licence |
Live |
Regatta |
| Gpsar333 |
Analyses |
Replays |
Press |
Overwiew& Getting started | Install | Adding maps | Send results | Applet | Speed measurements | Deleting spikes | Apparent wind | VMG |
What is VMG?
Going upwind
As everybody knows, sailing facing the wind isn't possible. Hence, when you want to go somewhere closer to the wind, you have to do several tacks in a zig-zag course.
Well, what course is the best to be upwind in lesser time? The answer isn't simple, since two criteria are to be taken into account:
- Linear speed (the speed your tachymeter will tell)
- Angle to wind. The closer to the wind, the best it is (for a given linear speed).
Introducing VMG
|
VMG is the projection of your speed on the wind axe. Mathematically, assuming your linear speed is S and your angle to wind id A, you get: VMG = S.cos(A) Consider two extreme cases to best understand. If your angle to wind is 90°, cos(90)=0, hence VMG=0. Even with a very high speed, you don't have any upwind ability. At the opposite, if your angle to wind is 0° (you need to be motor-powered), cos(0)=1, hence VMG=S, that is to say that you go upwind as fast as your linear speed. Let's consider a more interesting intermediate case, for example a 60° angle to wind, whose cosinus is 0.5: VMG= S/2. That is to say that your VMG is half your linear speed. For instance, a 15 knots speed with a 60° angle provides you a 7.5 knots VMG. |

|
|
For people reluctant to maths, let's have a more pragmatical view on VMG. Consider a sailor going upwind doing some tacks, from start point A to finish point B, A and B being in the wind direction. Besides, consider a motor-boat going from A to B, at constant speed, and, obviously, directly facing wind. If the sailboat and the motorboat starts and finish at the same time, they have the same VMG.
Here is a real example (out of windsurfing in Lago Di Garda). |
 |
In blue, real track. In red, a track built removing all intermediate points within the real track but the first and the last ones.
The aerage VMG of the sailor in blue over the whole track is exactly the same as the (constant) speed of the red virtual boat. Here, you can see it's 5.5 knots.
Accurate anlaysis with Polar diagram
For a given sailing gear, in a given context (wind and water), there is ONE angle that gives the better compromise, i.e. the better upwind ability. The best way to find it is to use a polar diagram, as provided in GpsAR.
The polar diagram provides the speed acheived for each course angle from 0° to 360°
 | 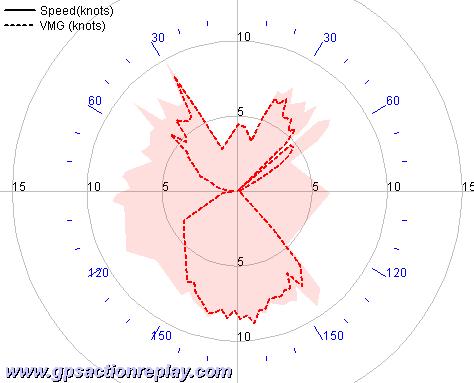 |
This graph represents speeds for each angle to wind, 0° being at the top, 180° at the bottom, 90° both on left and right (angles are symmetric on a vertical axe).
Besides angle, concentric circles indicates speed and VMG values (0, 5, 10, 15, 20, 25 knots on this example).
For a give angle, you get two values. The greater one is speed, and the smaller one, appering in dotted line, is VMG. Here, looking at the blue polar graph, you can see for the 90° angle that you get a 22 knots speed for the left side (starboard tack), and a 23 knots on the right side (port tack). The VMG is 0 knots in both cases, of course. Take another example, 60°. We get respectively 17.5 knots and 17 knots starboard and port for the speed, and 9 knots and 10 knots for the VMG.
Then, it's easy to see what angle maximizes the VMG. Upwind, for instance, the best VMG is acheived in the 35°-45° range depending on the tack, and downwind at 140° for both tacks.
This kind of diagram is very informative as it provides lots of data within one diagram, and delivers a whole charateristic of your performance at a look. It's particularly interesting to compare different gears
Further Analysis
The diagram we've just seen is informative as a whole sailing performance information. But when you want to analyse thorougly your data, at different moments of the sailing, it's better to consider more precise data. It's the main purpose of GpsAR to provide a "time-driven" information, since you can move the time cursor to whatever moment of your choice to get all information you want.
Moreover, rather than instant VMG and Angle to wind data, it's generally better to observe average data over a given distance. Indeed, we have to take into account the inerty when sailing, so that not to give too much importance to the values got just afer a change of course.
For instance, if a boat's course is 60° to wind at 7 knots, getting a 3.5 knots VMG due to the cosinus rule, and then point a little more to the wind, say 55°, it will first keep its 7 knots speed during some seconds. In the meanwhile, it gets a VMG=7.cos(55)=4.01 knots. But this VMG is very temporary and artificial (due to inerty), and will drop. Indeed, some seconds later, the boat's speed will drop to 6 knots only, providing a VMG=6.cos(55)=3.44 knots. So, the VMG increased in a first time to 4.01 knots, but in fact drops to 3.44 knots, to compare to the 3.5 previous value.
Consequently, what is suggested is to analyse performances upwind and downwind considering average values over a given distance. Here are some examples, the first one including a tack manoeuver, the second one a "straight" run. For each of them, the distance considered is 2000 meters, and the associated part of the track is highlighted.
 |  |
Hence, the respective 4.5 and 7.1 knots VMG obtained here give little part to inerty effects, and you can rely on it with confidence. On the other hand, be carefull that the wind is steady in direction on the whole distance taken into account. Otherwise, the VMG will be biased.
Introducing the PerformanceAnalysisTool (PAT)
It is possible to collect some results when analysing a track with GpsAR. You just have to press Alt+A at any moment to record the actual results, which are stored in a table for further analysis or for exchanging information, and generate a HTML page from it. Here is a excerpt of what you can get:
| Name | Date | Wind direction | Tack | Speed | VMG | Angle to wind | Length | Duration |
|---|---|---|---|---|---|---|---|---|
ACTIVE LOG | Sun Aug 08 04:44:54 CEST 2004 | 18 | Starboard | 13,682 | 6,409 | 62 | 2 027,059 | 288,000 |
ACTIVE LOG | Sun Aug 08 04:51:29 CEST 2004 | 18 | Port | 14,041 | 7,618 | 57 | 2 073,029 | 287,000 |
ACTIVE LOG | Sun Aug 08 05:07:08 CEST 2004 | 18 | Starboard | 13,484 | 3,914 | 75 | 2 088,031 | 301,000 |
ACTIVE LOG | Sun Aug 08 05:29:22 CEST 2004 | 18 | Starboard | 17,234 | -3,584 | 102 | 2 172,178 | 245,000 |
ACTIVE LOG | Sun Aug 08 05:39:10 CEST 2004 | 18 | Starboard | 16,571 | -2,356 | 97 | 2 011,858 | 236,000 |
Overwiew& Getting started | Install | Adding maps | Send results | Applet | Speed measurements | Deleting spikes | Apparent wind | VMG |