Welcome |
Video Manual |
Downloads |
Licence |
Live |
Regatta |
| Gpsar333 |
Analyses |
Replays |
Press |
Overwiew& Getting started | Install | Adding maps | Send results | Applet | Speed measurements | Deleting spikes | Apparent wind | VMG |
Looking for spikes and deleting them
If you want to process some speed statistics with GpsAR in order to know your performance, you'll have to check for any bad trackpoint and remove them. Otherwise, you could get some wrong speed results.
Indeed, when the satellite signals are not good enough, it can results in non accurate location. Sometimes, a GPS receiver can make a 150 meters mistake on a localisation, that results in a 100 km/h speed or so... It's true in particular when the receiver falls under water, even for one second.
I. Preparing view(s) to best analyse the track
First of all, prepare GpsAR options so that you'll get the most relevant views on the track for this purpose:- 1. Load (or download) the track to be analysed.
- 2. Select it clicking on its name in the "trajectories" list. This name may be "ACTIVE LOG" if unchanged from G7TOWIN, or "Download from GPS 1" if downloaded in GPSAR. Or an other name if you renamed it. The name will be highlighted in the list when selected.
- 3. Menu Options --> Path view settings --> Show trackpoints.
Now every trackpoint appears as a circle. - 4. Check the "Speed" in "show graphs" on right top of the interface. Hence the Tachygraph is active.
- 5. Zoom slider max to the left. If not enough for you, just click as many times as needed on the screen to zoom-in (or right-click to zoom-out).
- 6. Menu Dynamic View --> Speed (knots)
- 7. Click on "center" button (it's one of the 6 buttons) just below the "Trajectories" list.
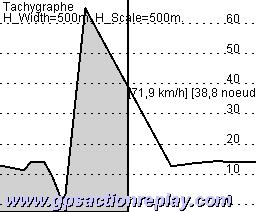
Now, with points 1 to 6, you've configured GPSAR so that you're always centered on the current position of you track, you see the trackpoints, and you're zoomed quite a lot. It's the ideal configuration to look for spikes. It looks like the screenshot below:
II. Finding and Deleting spikes
- 8. Menu File --> Trackpoints Data Table. You get a list of all the trackpoints with a lot of data, including speed and acceleration. You can sort this table through one of its columns. Two columns are particularly interesting. The most interesting one is acceleration: click on Linear m/s² column name, so that the table is sorted from best acceleration to worst.
The trackpoints data table when generated, chronologically sorted by default (from point n°1, etc...) 
The table once sorted by the "linear m/s²" column (click on the colmun name to sort, or shift-click to reverse-sort) 
- 9. Click on the first row of the table. When selecting it, time is automatically set to the moment related to this trackpoint, and so are all available views in GpsAR. In particular, you can observe the main view:

Main view Tachymeter On this screenshot, you can observe that the time has been set automatically so that we're at the middle of the related segment. Besides, we can see that the speed of the segment, 65.1 knots, is printed on the main scree and corresponds to the value that we found in the table. It's time to decide whether there is a spike or not. The acceleration value is very important (more than 1G, impossible when surfing), and the speed is anything but plausible. You can move a little the time cursor manually, or playing the animation forward or backward, to see what are the speeds around this segment.
- 10. If the point is suspicious and want to delete it, you just have to press SHIFT and click on "Delete" (it's one of the 6 buttons) simultaneously (be carefull: if you don't SHIFT, you erase the whole track). You can SHIFT-delete as many times as necessary (usually one time, sometimes 3 or 4 times if you crashed in the water). All the views are instantly adjusted. Hence, here, we finally got:
You can see on both graphs that there is no more spike, just deleting one trackpoint. Sometimes, it may require more trackpoints to be removed.

Main view Tachymeter - 11. Go back to point 8 as many times as needed, untill you erased all spikes.
- 12. Once it's done with acceleration, you may do the same with "speed", sorting the table with the Speed column, and check again for incredible values.
Remarks and suggestions
An other way to process (rather than to use the Trackpoint data table) is to use the "virtualRun&stat" --> Compute speed statistics, and then click on the best speeds. However, it doesn't provide the acceleration device which is so handy to look for spikes.
Besides, my suggestion is to use the several views to check thorougly the spikes. Indeed, you can see a curious change of direction in the main view, but also a curious change of altitude, or a change of speed (in the altigraph and speedgraph respectively).
This shouldn't take that much time since you usually will get from 0 (in most cases) to 2 or 3 spikes.
Overwiew& Getting started | Install | Adding maps | Send results | Applet | Speed measurements | Deleting spikes | Apparent wind | VMG |